Wi‑Fi Studio.
Inspect. Design. Survey. Assure.

Bring Wi-Fi survey, Wi-Fi design and performance monitoring into one connected workflow. Inspect the network, model coverage in 2D and 3D, validate on site, deliver professional reports and monitor every site over time with on-site sensors.

Download Inspect for Mac - Free

Inspect is a free download for Mac. Design, Survey and Assure need beta access, so request it above.
Universal app for Apple silicon and Intel Macs, notarised by Apple.
Remote Inspect Environment and remote packet captures are free for everyone until 31 December 2026.

One Studio. Switch between Inspect, Design, Survey and Assure as the project moves from plan to day-to-day operation.

Wi-Fi Studio Design workspace in 3D, showing a warehouse with racking, ceiling-mounted access points, the selected access point's radio settings and a predicted coverage heatmap.
The problem worth solving

Signal strength is not network quality.

Strong signal does not always mean a reliable connection. Assess coverage alongside connection quality to understand whether an issue sits within the local Wi-Fi network or further along the path to the internet.

Survey measures the local Wi‑Fi leg and the path beyond the router separately, and scores them separately. This example survey returns three different answers:

82CoverageGood, but one weak spot and one poor reading.
98Local networkNo latency, jitter or packet-loss issues found.
87InternetThe connection beyond the router is healthy.

See where the problem is — and what to do about it.

One project. Every stage.

Wi-Fi Studio runs your Wi-Fi project from first design to day-to-day operation.

  1. 01 Design

    Design it first

    Model coverage in 2D and 3D before anything is installed.

  2. 02 Install

    Hand over the plan

    Installation and configuration guides for every team on site.

  3. 03 Approvals

    Sign off each stage

    Approvals at every step before work moves on.

  4. 04 Progress

    Track progress

    One dashboard for installation and configuration, site by site.

  5. 05 Survey

    Prove it works

    Compare predicted coverage with what you measured on site.

  6. 06 Assure

    Keep it working

    On-site sensors test performance over time, problem sites first.

Inspect

Understand the wireless environment.

Connect the scan bridge to explore nearby Wi-Fi networks, compare reported signal levels and channels, and watch how they change over time. Start with a clearer picture of the environment before you plan or survey.

  • Channel graphs for nearby Wi-Fi networks
  • Signal history to follow changes over time
  • Detect the internet provider on your active connection
  • Available measurements depend on the scan bridge, adapter and operating system
Wi-Fi Studio Inspect channel graph showing 2.4 GHz and 5 GHz networks in an example corporate office
Inspect · Channel graph · Example corporate network
Explore Inspect

Move from a channel overview to signal history. Compare nearby networks, identify channel overlap and follow reported signal changes before choosing the next diagnostic step.

Inspect · Channel overviewView full screenshot ↗
Inspect · Channel overviewExample scan data shows neighbouring networks across 2.4 and 5 GHz. Measurements depend on the connected scanner and adapter.
Wi-Fi design

2D and 3D predicted modelling

Import a floorplan, set the scale and model the walls and objects that affect signal. Place access points in 2D, then explore the same design in 3D to inspect mounting heights, antenna orientation and predicted coverage.

  • AP and antenna selection, with per-radio settings
  • Model materials, mounting positions and antenna direction
  • Explore primary and secondary coverage, SNR and interference
  • Predictions reflect your model and assumptions; verify them on site
Wi-Fi Studio Design 3D view of a warehouse with access points and a predicted coverage heatmap
Warehouse design · 3D view · Predicted coverage
Explore Design

Build the floorplan in 2D, then explore mounting height, antenna direction and building geometry in 3D.
Select equipment to keep the model and its configuration in view.

Office · 2D planningView full screenshot ↗
Office · 2D planningAn illustrative office layout with eight access points, meeting rooms and open workspaces.
Warehouse · 3D predicted modellingView full screenshot ↗
Warehouse · 3D predicted modellingA warehouse populated with access points, directional antennas and storage racks. Review mounting positions, antenna orientation and predicted coverage in 3D.
Install & Configure

Hand the design to the teams who build it.

Open Installation & Configuration from a saved design. Installers see where and how each access point goes; the Wi-Fi consultant sees the radio settings to configure and verify.

  • Installation details for every access point: height, mounting, cable drop and accessories
  • Channel and power settings for whoever configures the network
  • Design sign-off unlocks field work; each team confirms its stage is complete
  • Track installed and configured access points in one progress view
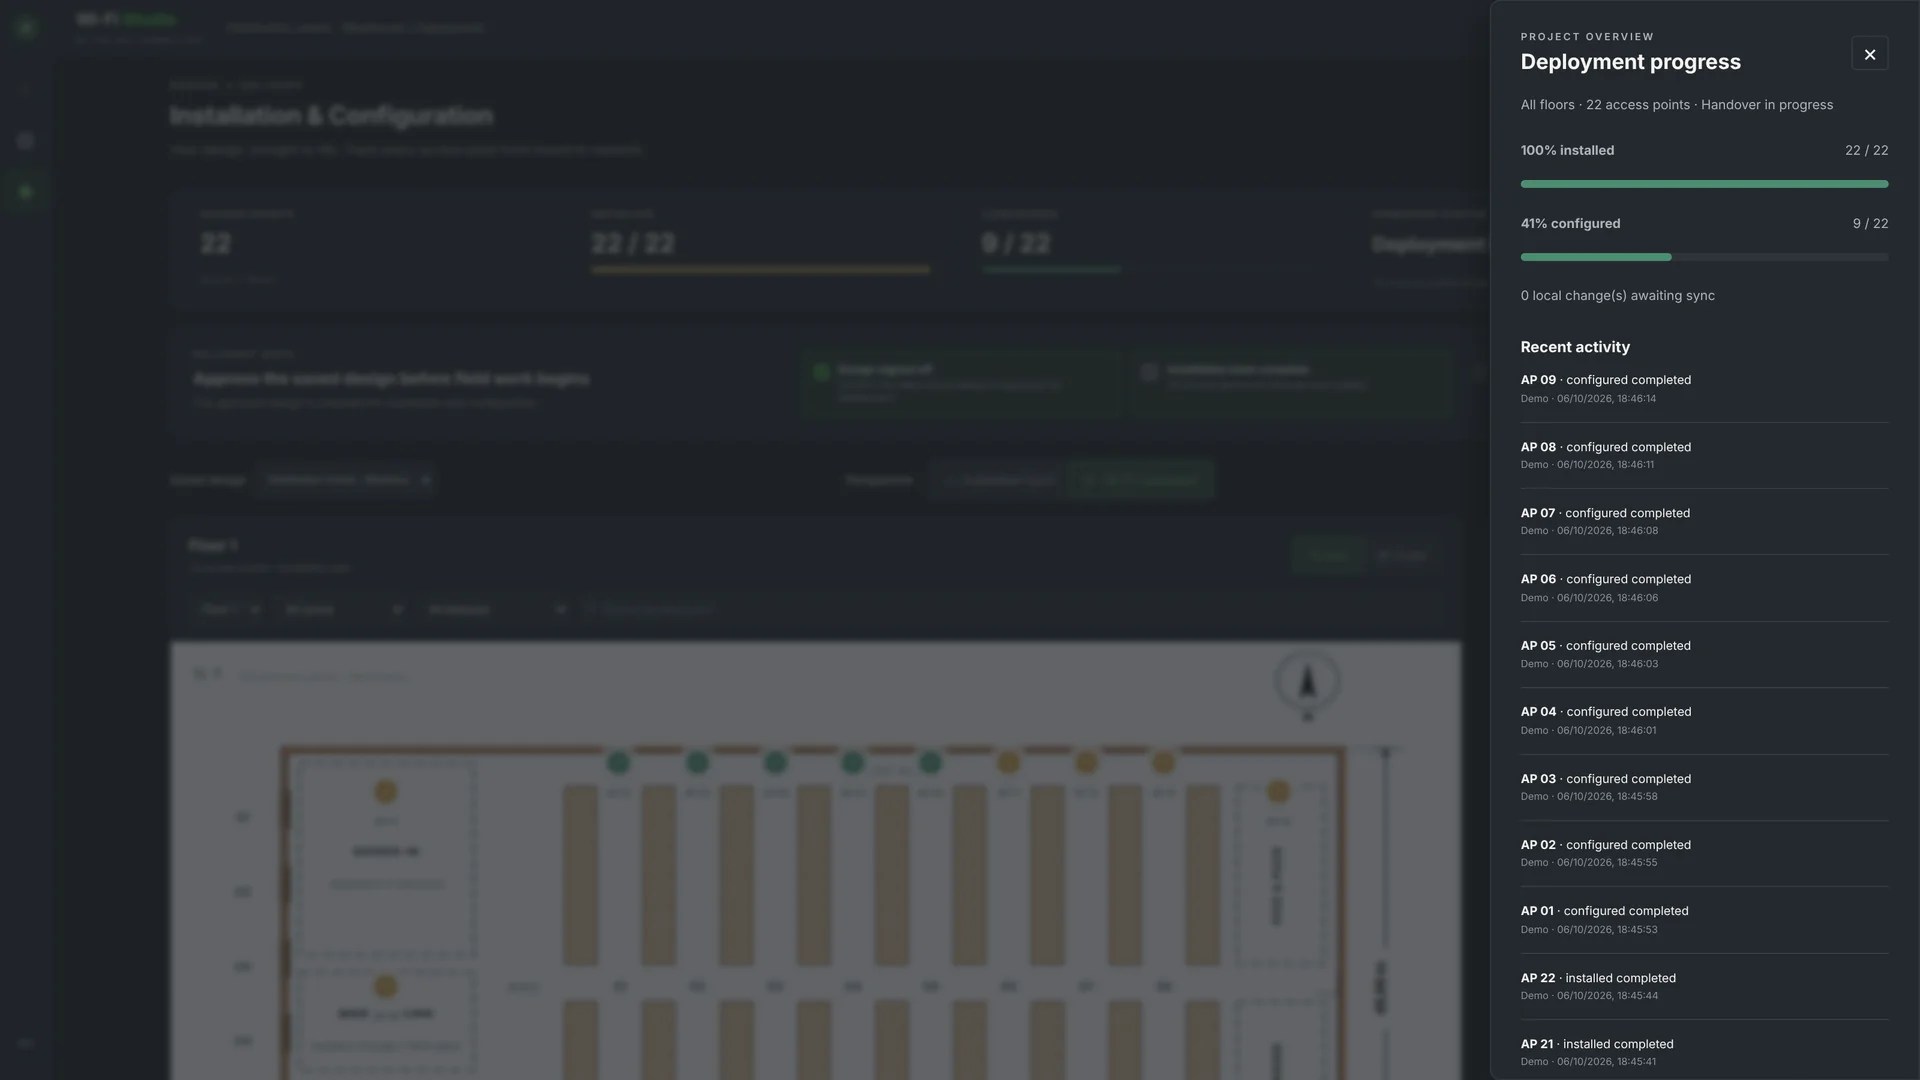
Wi-Fi Studio Installation & Configuration for an example warehouse, with installation and configuration progress, the design sign-off and access points on the floorplan.
Warehouse · Installation & Configuration · Example project
Explore Install & Configure

Every access point carries its own two-step check. The installation team marks it installed, the Wi-Fi consultant marks it configured, and the progress view shows where the project stands. The example project and its progress are illustrative.
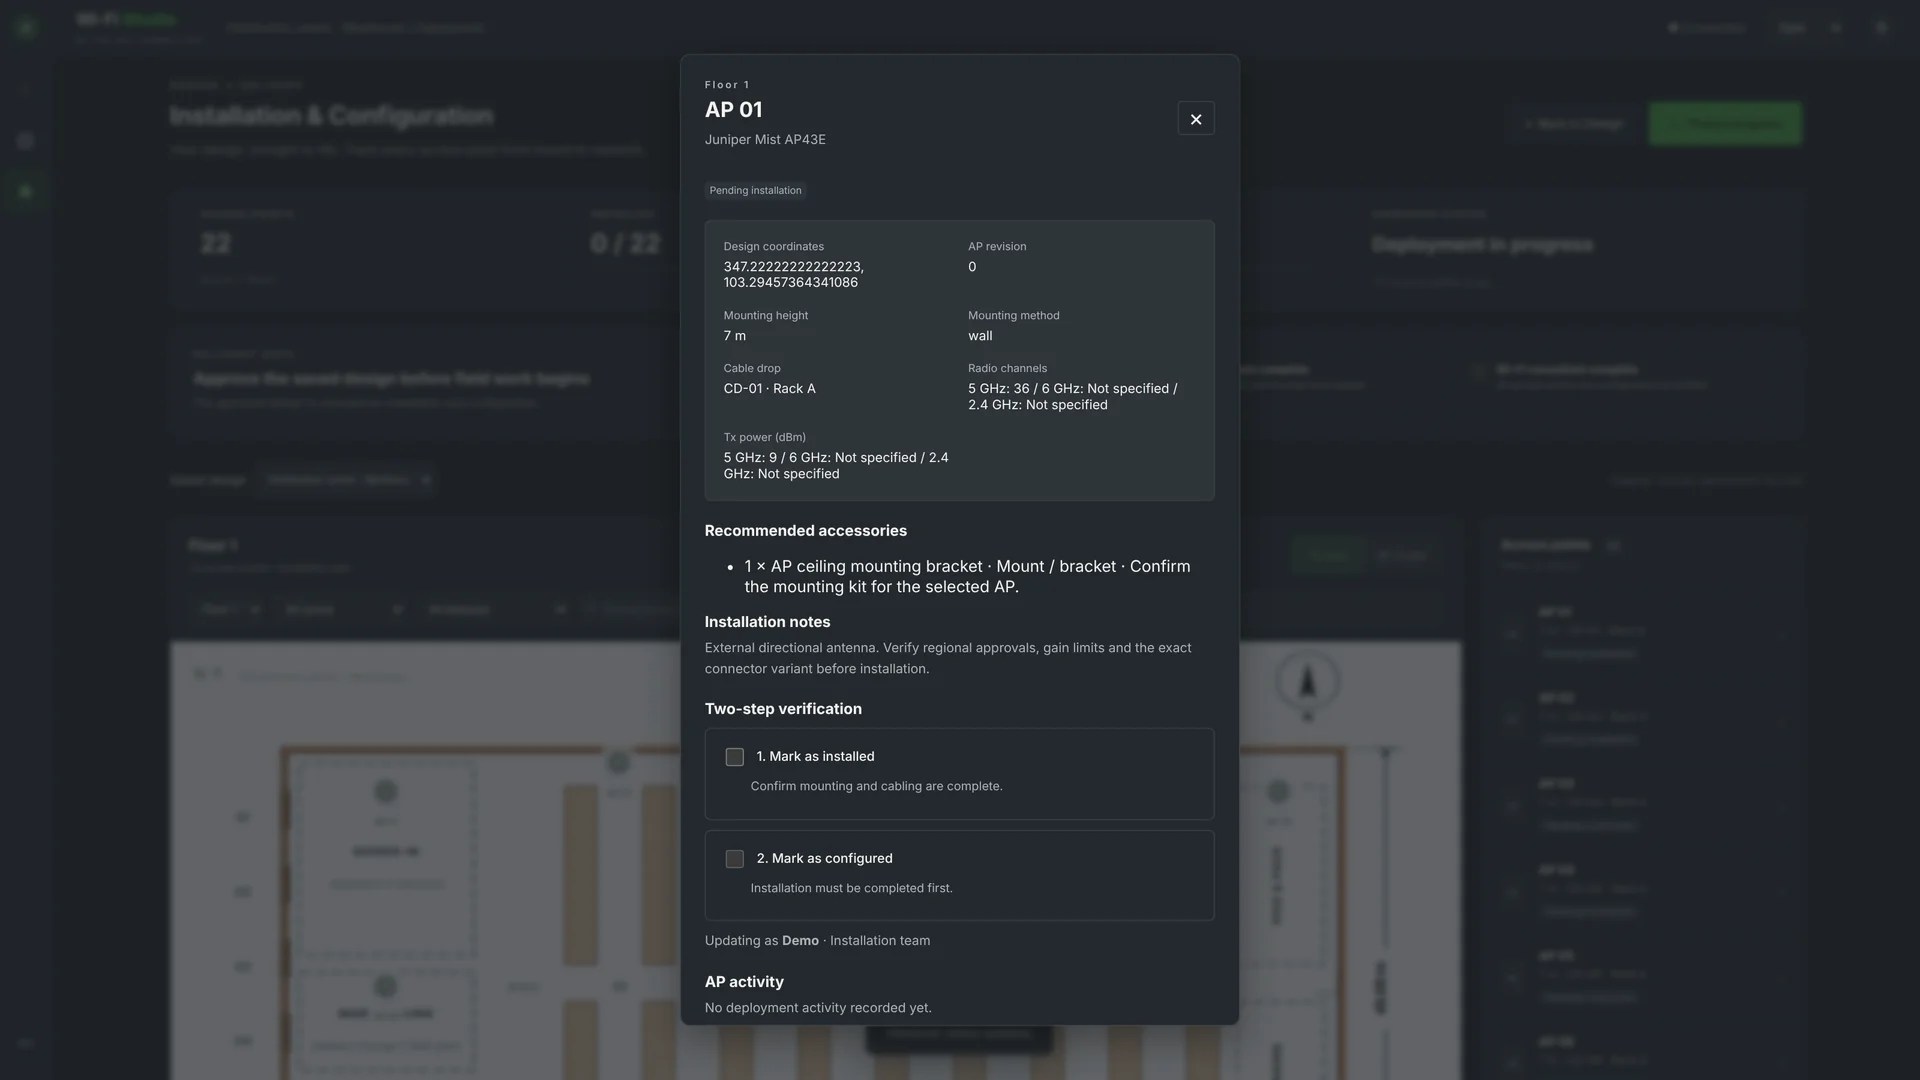
Warehouse · Install guideView full screenshot ↗
Warehouse · Install guideMounting height and method, cable drop, recommended accessories and installation notes for each access point, then mark it installed.
Warehouse · Configuration guideView full screenshot ↗
Warehouse · Configuration guideThe Wi-Fi consultant view lists each access point’s channels and transmit power to configure and verify.
Warehouse · Sign-offView full screenshot ↗
Warehouse · Sign-offField work unlocks once the saved design is signed off. The installation team and the Wi-Fi consultant each confirm when their stage is complete.
Warehouse · Deployment progressView full screenshot ↗
Warehouse · Deployment progressInstalled and configured access points across the project, with recent activity.
Wi-Fi survey

Two points. A clearer view of coverage.

Mark the start, walk a straight section of the site, then mark the end. Two-point surveying places the collected readings along that segment, making warehouse aisles and long corridors straightforward to document.

  • Numbered start and end points shown on the heatmap
  • Signal measurements collected along each straight walk
  • Review individual survey runs, with notes and photos in context
  • Reading positions are estimated from elapsed time between the two points
  • Compare the design prediction with a post-deployment survey, location by location
Wi-Fi survey heatmap of a warehouse showing two-point walks, numbered endpoints and signal readings along the aisles.
Warehouse survey · Four two-point walks · Illustrative readings
Explore Survey

This warehouse example shows four completed two-point walks. Each segment retains its start, end and collected readings, so you can review the heatmap alongside the route. Positions are estimated along each straight segment; the example readings are illustrative.
After installation, Validate Design opens a post-deployment survey with the design’s coverage target, so predicted and measured signal can be compared at the same locations.

Warehouse · Two-point heatmapView full screenshot ↗
Warehouse · Two-point heatmapNumbered anchors show where each walk started and finished. Colour shows how signal changes along the aisle.
Warehouse · Survey runsView full screenshot ↗
Warehouse · Survey runsReview named walks and their measurement counts, distances and durations.
Warehouse · Design vs measuredView full screenshot ↗
Warehouse · Design vs measuredPredicted and measured signal at the same surveyed locations, checked against the design’s coverage target. Illustrative readings.
Warehouse · Location by locationView full screenshot ↗
Warehouse · Location by locationEach reading lists the predicted and measured signal, the difference and the result against the target. Export the comparison as CSV.
Reporting

The answer first. The evidence after.

Findings lead for the people who sign off, numbered recommendations give engineers the fix, and the evidence sits behind both.
  • Plain-language ratings from Excellent to Poor, scored on the weakest area rather than an average.
  • Design against measured, location by location: Meets, Close or Does not meet.
  • Findings and numbered recommendations, reviewed and edited by an engineer before they go out.
  • Evidence at the back: heatmaps, routes walked, measurement tables, channel use and AP photos.
  • Assure period reports show site health, failed and slow checks, and where the problem is.
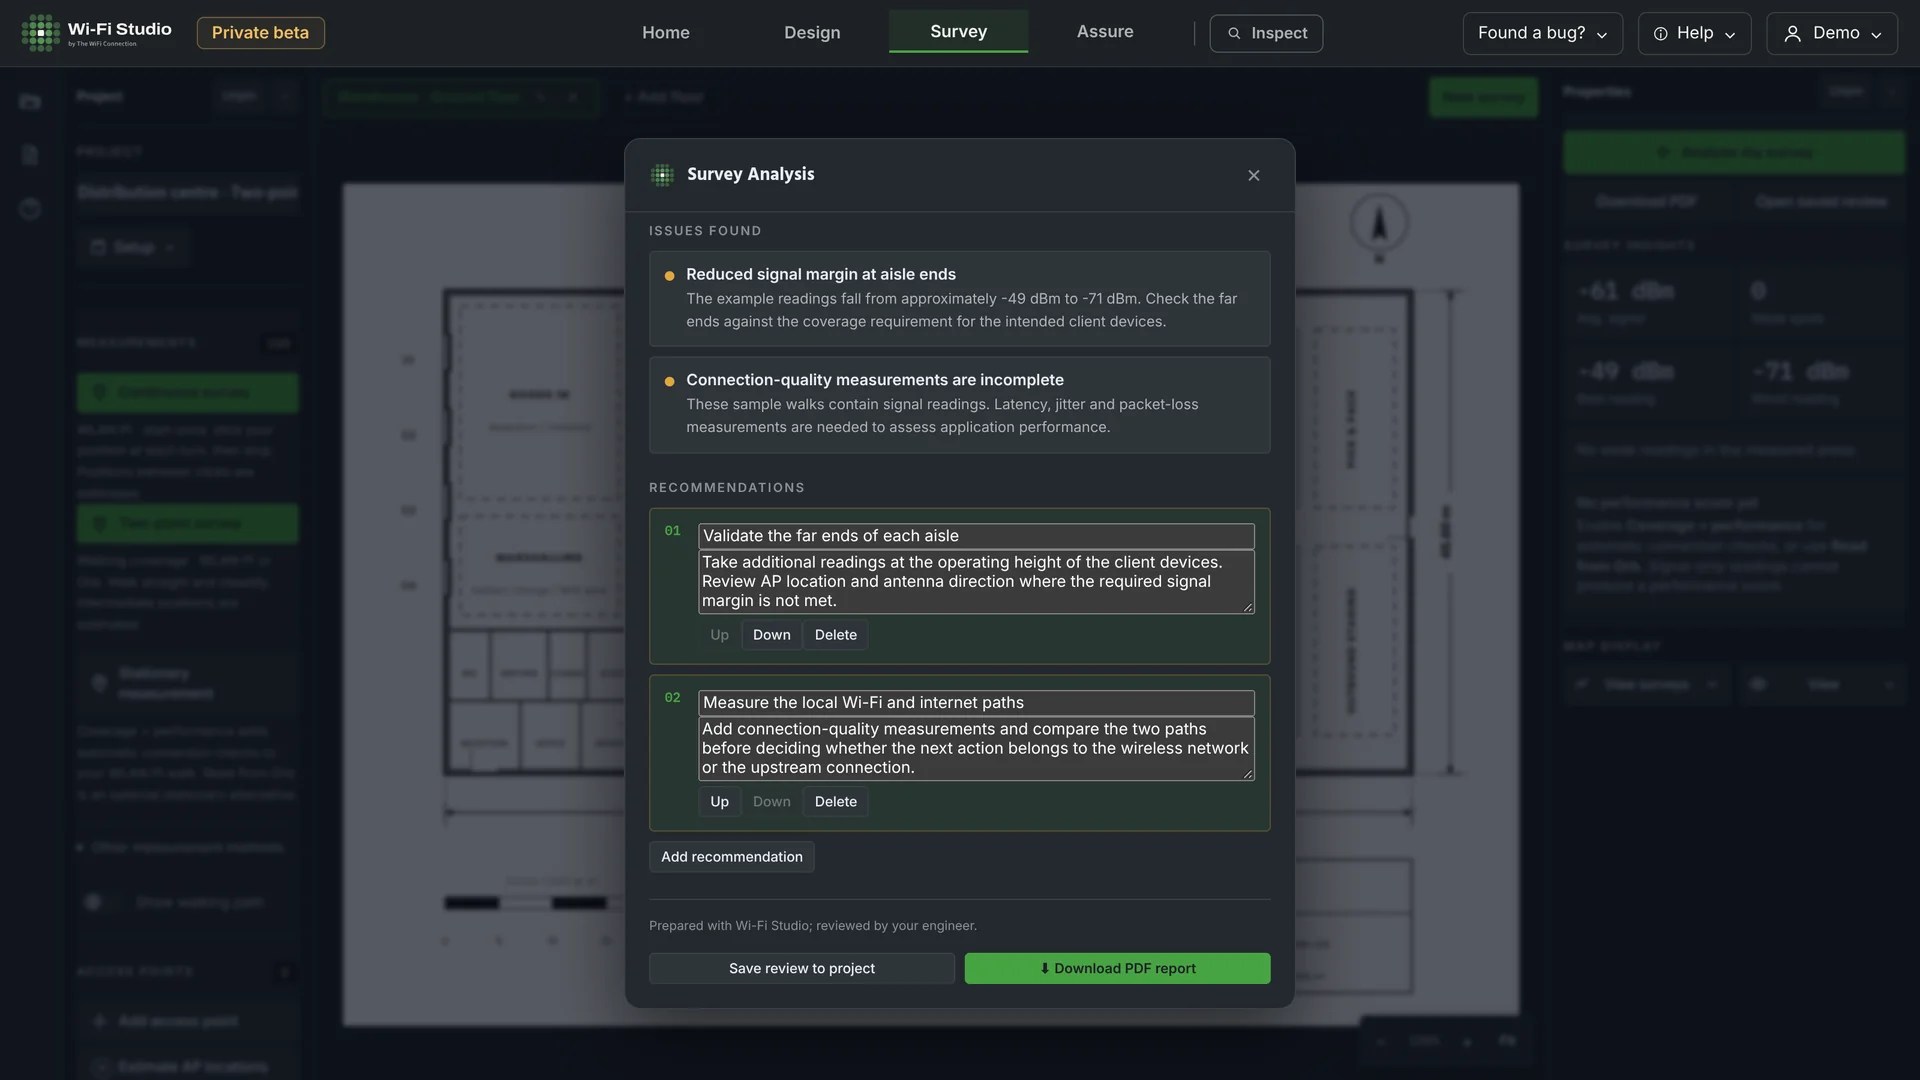
Wi-Fi survey analysis outlining issues found, supporting measurements and recommendations to resolve them.
Survey analysis · Issues found and recommended actions
Explore Reporting

Give stakeholders a clear record of the design and the survey. Export PDF reports, review equipment quantities and use the findings and recommendations to plan the next action.

Bill of materialsView full screenshot ↗
Bill of materialsAPs, external antennas and installation accessories, with quantities and references back to the plan.
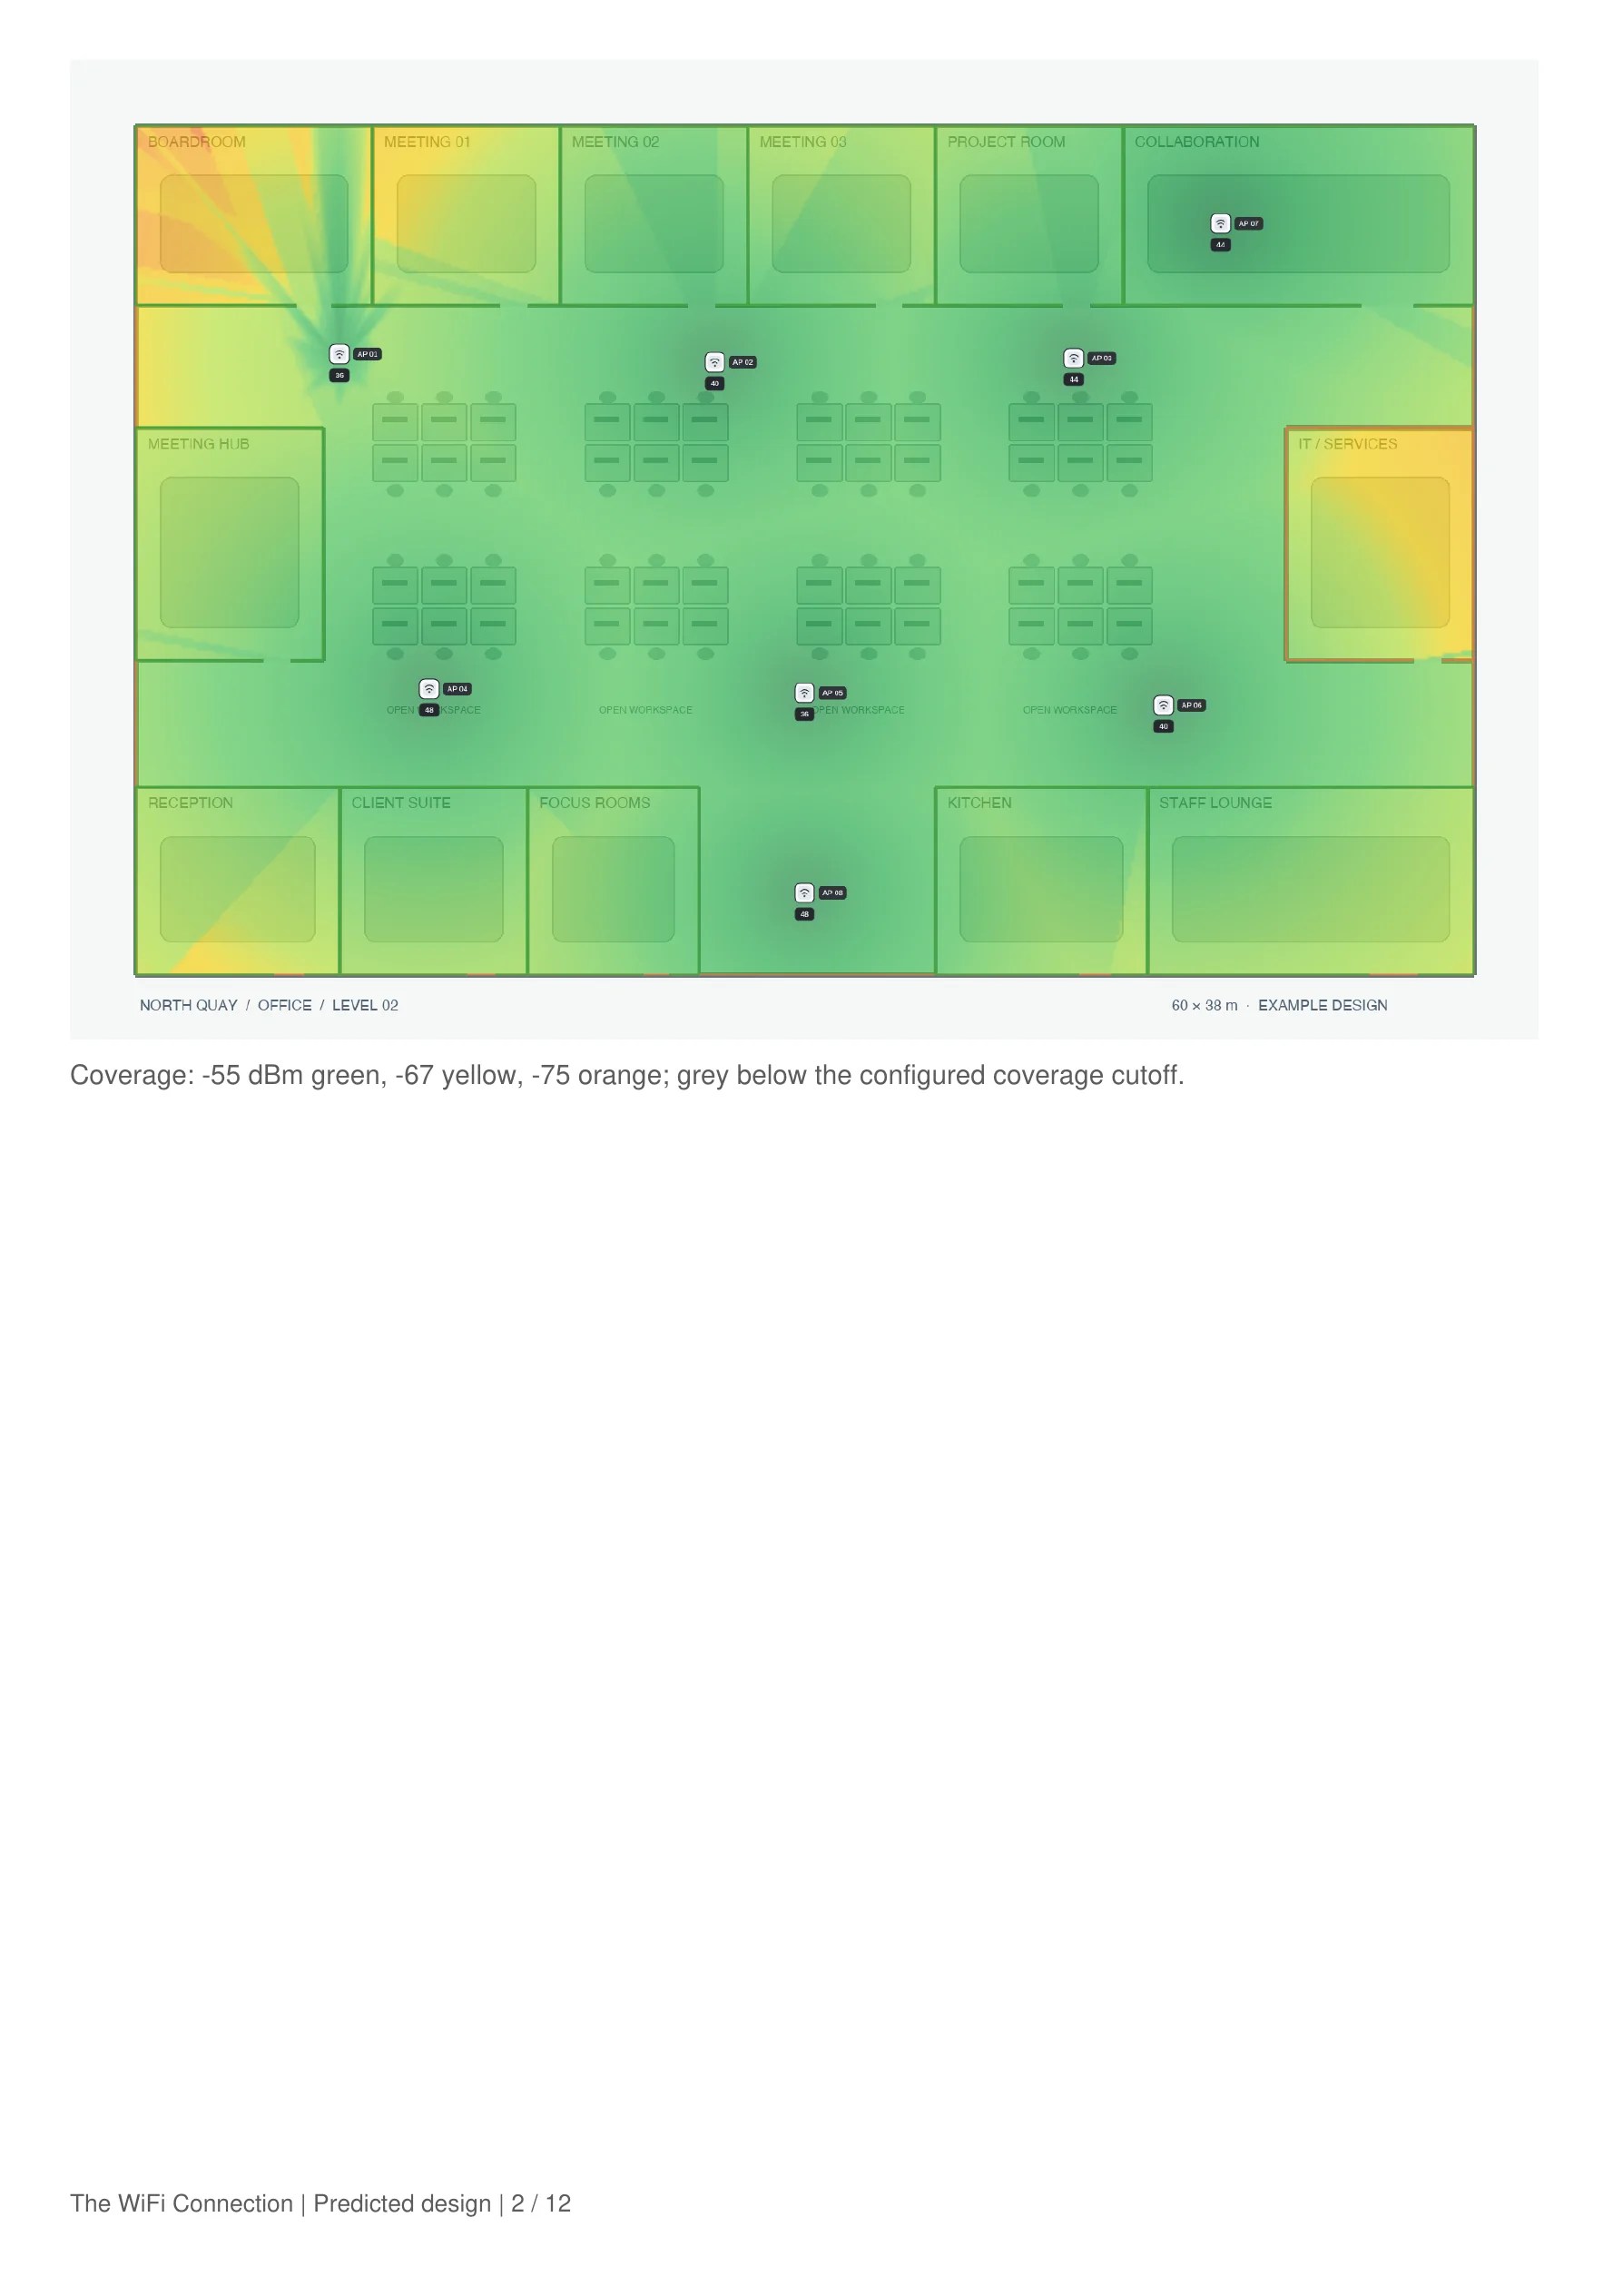
PDF report · Coverage mapView full screenshot ↗
PDF report · Coverage mapA page from the exported office report. A perimeter coverage zone confines the Wi-Fi heatmap to the building, with the prediction and colour scale shown together.
PDF export · Report contentsView full screenshot ↗
PDF export · Report contentsInclude AP and wall schedules, channels, zones, model assumptions and saved engineering results.
Survey analysis · Issues and next stepsView full screenshot ↗
Survey analysis · Issues and next stepsIllustrative warehouse report: review the findings alongside recommended checks and actions to resolve them.
Explore Engineer toolbox

Six practical tools for the decisions behind the design. Explore the inputs, review the results and keep supported engineering calculations with the project and its PDF report.

RF power and link budget

Assess the link before installation. Enter transmit power, antenna gain, cable losses, frequency and distance; then review EIRP, path loss, predicted receive level and link margin. Save the calculation with the design for your report.

RF power and link budgetView full screenshot ↗
RF power and link budgetReview the predicted link margin against the receive level your design requires. These are planning estimates to validate on site.

SSID overhead

See how SSIDs consume beacon airtime. Compare SSID and radio counts, beacon size, interval and transmit rate to understand the effect of your configuration before adding another network.

SSID overheadView full screenshot ↗
SSID overheadIllustrative configuration: four SSIDs across three radios sharing a channel produces an estimated 4.97% beacon airtime. The result covers beacon transmission, rather than total channel utilisation.

MCS lookup

Translate radio settings into nominal PHY rates. Select the Wi-Fi generation, channel width, spatial streams, MCS index and guard interval, then compare modulation, coding and the rate table.

MCS lookupView full screenshot ↗
MCS lookupWi-Fi 6, 80 MHz, two spatial streams and MCS 11 give a nominal PHY rate of 1,201 Mbps. Actual application throughput is lower.

PoE budgeting

Plan switch power and port capacity together. Add device quantities and datasheet power requirements, set the switch budget and reserve, then review class-based power allocation, available headroom and per-port checks.

PoE budgetingView full screenshot ↗
PoE budgetingExample budget: eight devices, a 370 W switch and a 20% reserve. The tool shows 240 W allocated at the switch and 56 W remaining after reserve.

Antenna connector guide

Quickly shortlist connector-compatible antennas, then preview available antenna patterns directly on your floorplan. Filter by connector style and count, confirm the matching AP and antenna combination, and compare predicted coverage to find the best pattern for your design. Switch between antennas and adjust power, height, orientation and downtilt before placing the AP.

Antenna connector guideView full screenshot ↗
Antenna connector guide1 · Filter the shortlist. This example uses RP-TNC, four connectors per antenna and one assembly, matching the selected AP’s four connections.
2 · Confirm the connector matchView full screenshot ↗
2 · Confirm the connector matchThe green tick confirms that the selected AP and antenna have matching connector counts and styles. The result states exactly what matches; radio suitability and manufacturer requirements are checked separately.
3 · Preview and compare antenna patternsView full screenshot ↗
3 · Preview and compare antenna patternsSwitch between connector-compatible antennas with Previous and Next. Where a radiation pattern is available, preview its predicted coverage on the floorplan, adjust installation settings and choose the best fit before placing the AP.

Wall-loss measurements

Bring site evidence back into the model. Enter repeated RSSI readings or import survey points, mark the reference and through-material positions, and review the observed drop. Apply a reviewed loss to the selected wall and band when the measurement conditions are comparable.

Wall-loss measurementsView full screenshot ↗
Wall-loss measurementsIllustrative samples show a 12 dB observed drop. The tool keeps readings, measurement conditions and notes together for review before a material loss is applied.
The WiFi Connection Inspect. Design. Survey.
thewificonnection.com